Koushal Kumar

Data Analyst
Data Analyst
Technical Skills: Python, SQL, Power BI, Excel
Education
-
B.Tech, ECE Thiagarajar College Of Enginnering (May 2021)
Work Experience
L2 .Net Developer @ Wipro (June 2021 - Present)
- Analyzed and inspecting different scenarios of occurrence for certain Bugs in Android as well as Windows UI of HP Printers.
- Applied Unit testing for Migrating the Servers to LR0 Network to Improve the Cybersecurity.
- Collected Data and Introspected the same to determine different size of pages supported for various HP printers.
- Built Submenu for Diagnosing Sensor Test for SFP Products to automate the manual task and increase the efficiency by 30%.
Data Scientist Intern @ Experian (December 2019 - April 2020)
- As an Intern, created “IMAGE RETRIEVAL ALGORITHM” using Open CV and python in which for query image you will get desired output similar to that.
Projects
Ultimate 11
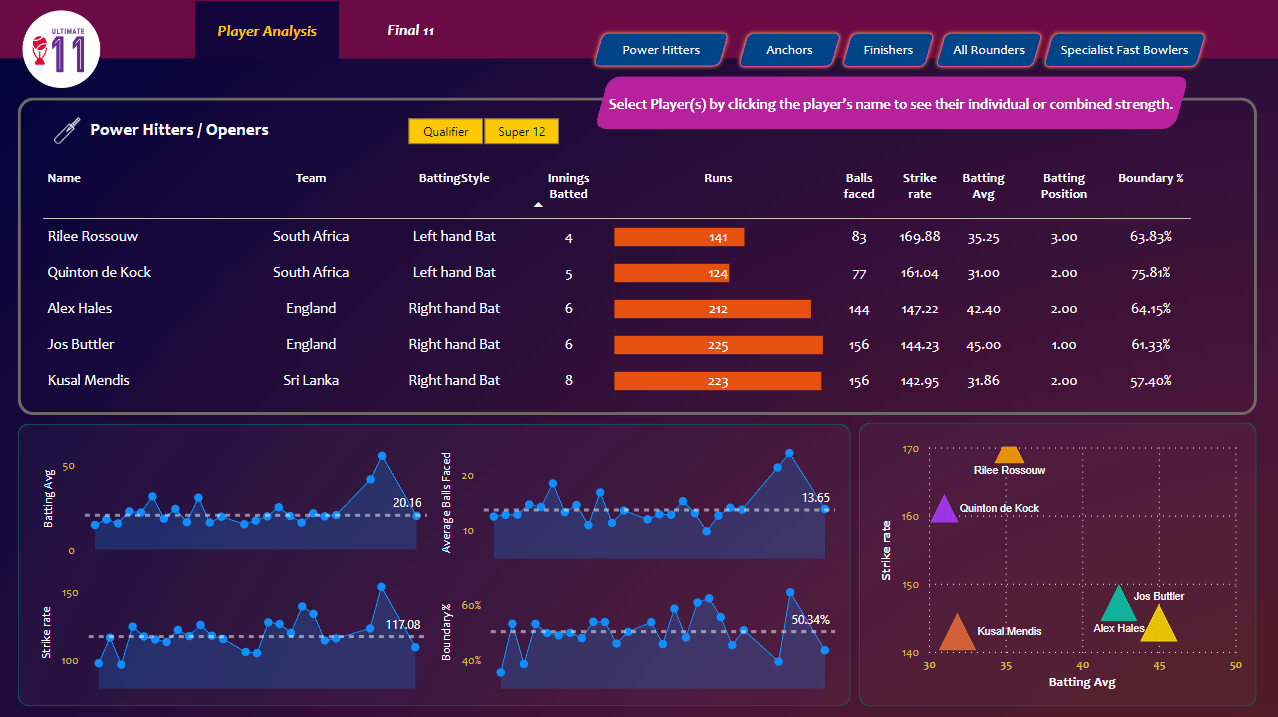
- The project objective is to select the best 11 cricket players from the 2022 World Cup data.
- The project methodology is as follows:
- Data collection: The data was sourced from the ESPN cricket info website, which provides comprehensive statistics and analysis of cricket matches and players.
- Data cleaning and transformation: The data was processed and formatted according to the project requirements, such as filtering, grouping, aggregating, etc.
- Data visualization and analysis: The data was visualized and explored using various features of Power BI, such as barchart, treemap, slicer, etc., to create a dashboard that shows the performance of each player in different aspects, such as batting, bowling, fielding, etc.
- The project outcome is a dashboard that displays the best 11 cricket players from the 2022 World Cup data, based on various criteria and metrics, such as runs scored, wickets taken, matches played, strike
rate, economy rate, etc. The dashboard also allows the user to interact with the data and filter it by different dimensions, such as team, match, player, etc.
Overview of the Dashboard

Shopping Store Analysis
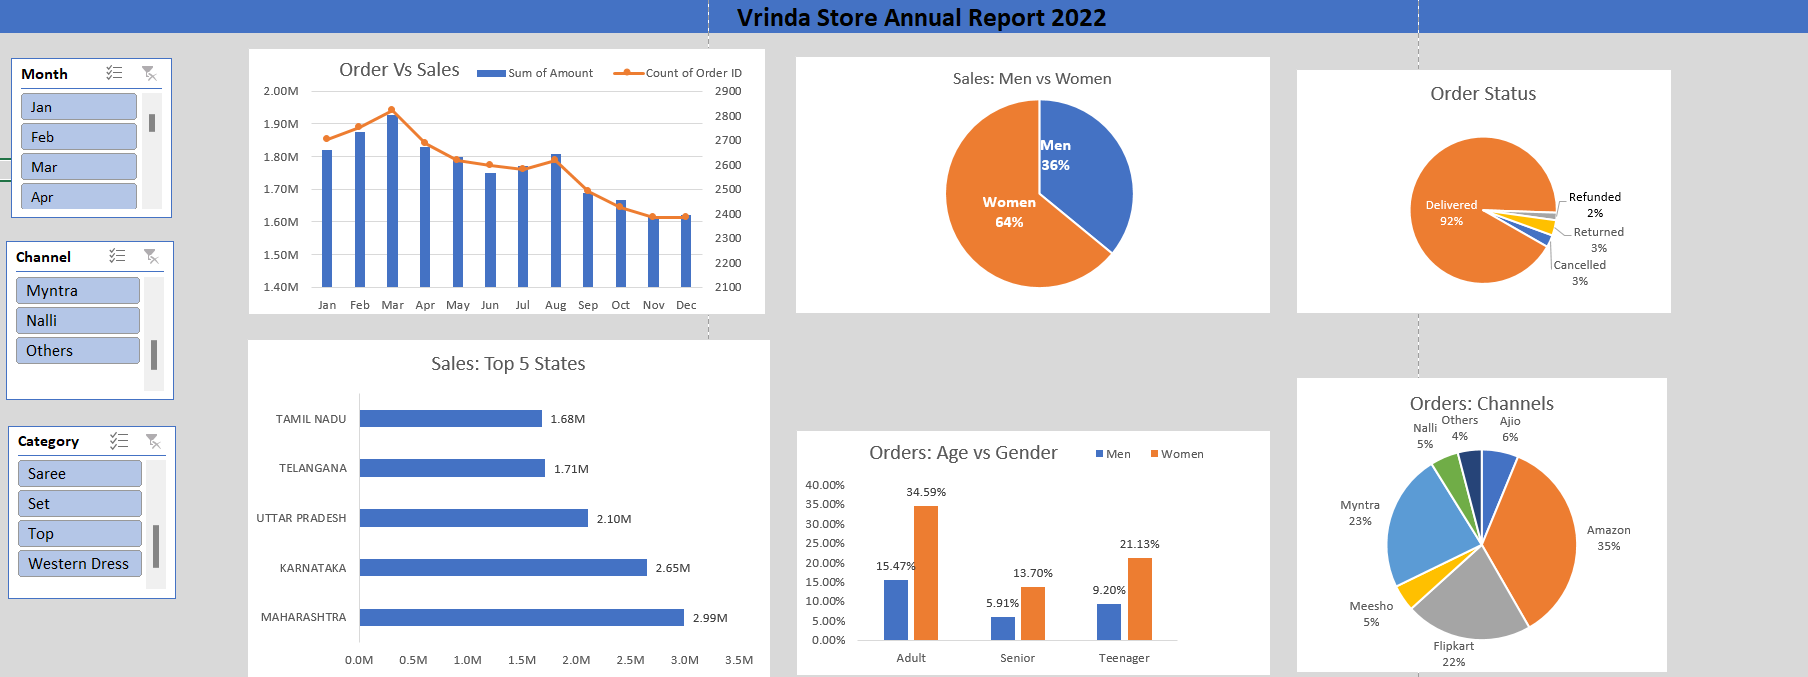
- This project aims to create an annual sales report for Vrinda store for the year 2022, in order to help Vrinda understand their customers and grow more sales in 2023.
- The project involves data cleaning and data transformation, followed by data analysis and visualization in Excel, using the given data from Vrinda store.
- The project uses pivot tools and charts such as clustered column, pie, combo, bar, and slicer to create an interactive dashboard that displays the key metrics and trends of the sales performance and customer behavior of Vrinda store in 2022.
- The project provides valuable insights and recommendations for Vrinda store to improve their sales and customer satisfaction in 2023, based on the data analysis and visualization results.
Overview of the Dashboard

Youtube-Channel-Scrapping
- This project leverages the YouTube API to gather, structure, and analyze valuable data from multiple YouTube channels, providing insights into channel names, subscriber counts, total views, and video upload counts.
- Data preprocessing plays a crucial role in ensuring data accuracy and organization, setting the stage for more in-depth analysis.
- Visualizations created using the Seaborn library offer a clear comparison of subscriber counts, total views, and video quantities across the selected YouTube channels, making complex data more accessible.
- The special functions, ‘get_video_ids()’ and ‘get_video_details()’, help us fetch video IDs and important video info like titles, publish dates, views, likes, and comments. This gives us a deep dive into what’s inside these channels.
- The project’s data export phase ensures that the collected and analyzed video data can be saved into your local system for further exploration, or sharing purposes.
Income Statement Dashboard
-
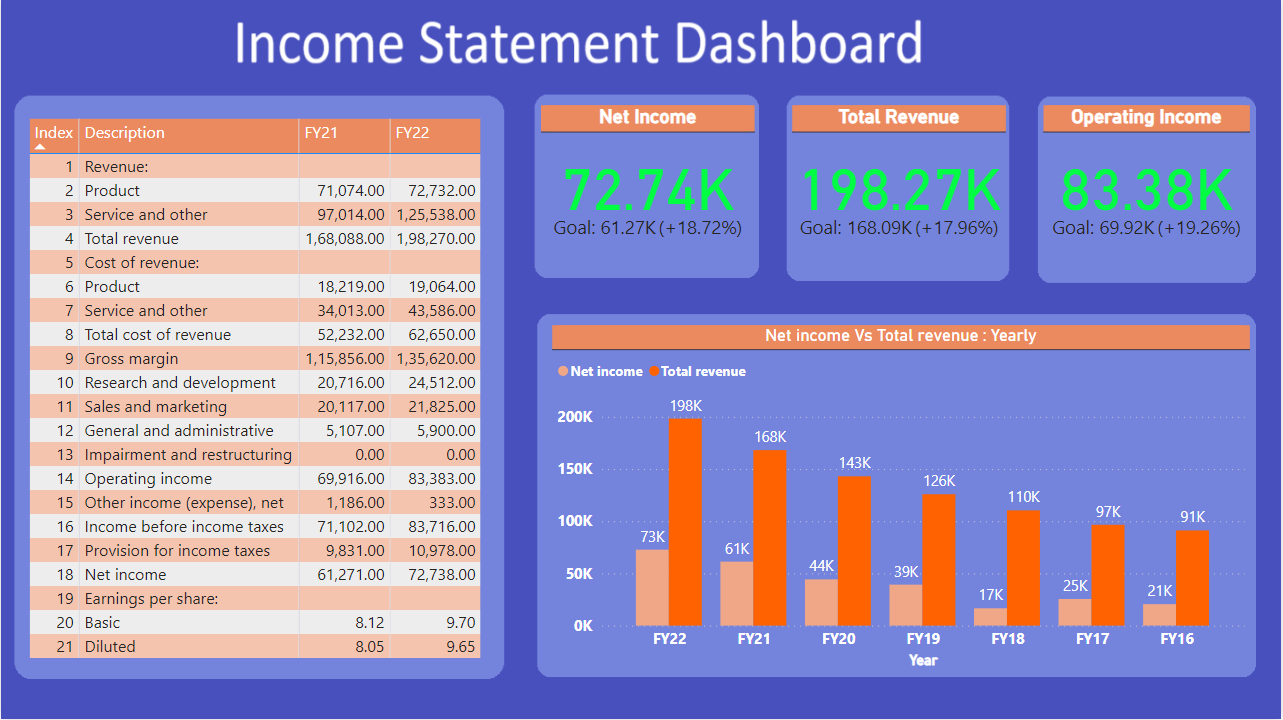
Project Overview: Created a comprehensive income statement dashboard using Power BI to analyze financial data from FY2016 to FY2023 Q2.
-
Data Source: Utilized Microsoft financial data, specifically the yearly income statements, from FY2016 to FY2023 Q2, available in the “FinancialStatementFY23Q2.csv” file.
-
Data Processing: Performed data cleaning, processing, and transformation using Power Query editor, ensuring data accuracy and consistency for analysis.
-
Visualization: Employed various Power BI visuals, including clustered column charts, tables, and KPIs, to visualize and analyze the financial data effectively.
-
Findings: FY22 exhibited remarkable growth, with a 17.9% increase in total revenue compared to FY21. The “Service and other” department saw a substantial revenue increase of 29.4%, while the “Product” department displayed a 2.3% growth. Additionally, gross margin, operating income, and net income demonstrated significant improvements.
-
Efficiency: Notably, the company became more efficient in generating profits from its revenue in FY22, with net income as a percentage of total revenue increasing from 36.4% in FY21 to 36.7% in FY22.
-
Conclusion: The financial performance of the organization showed substantial improvement in FY22, indicating growth and financial stability. Enhanced operational efficiency was reflected in the increased net income as a percentage of total revenue.
Overview of the Dashboard
